
Chart Studio lets you create, style, and save custom SVG charts linked to Excel data sources. It provides a central workspace for mapping data, formatting charts, and managing saved charts. Because charts remain linked to their Excel data sources, you can keep them aligned with the underlying data
Chart Manager
The Chart Manager in the Integrate widget is the central location for creating and managing charts. From Chart Manager, you can:
-
Select an Excel data source to create a chart.
-
Access charts you have already created.
-
Download charts as editable SVG files for use in project documents.
How to build charts in Chart Studio
Navigate to Charts tab in Integrate section.
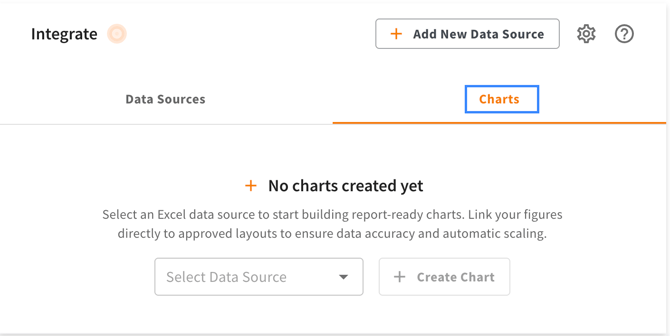
Choose the Excel data source you want to create charts from in the Select Data Source dropdown and then click Create Chart. Please note that you need data source permissions (Viewer or Editor) to be able to make charts using the data source.
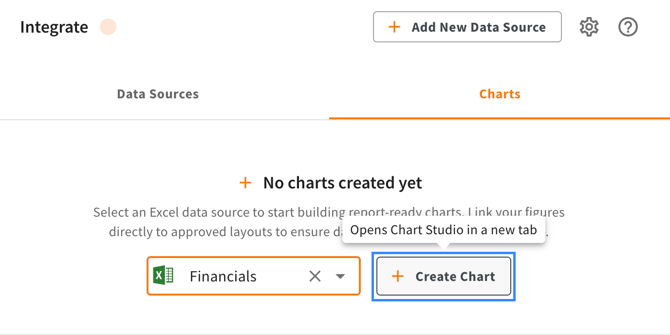
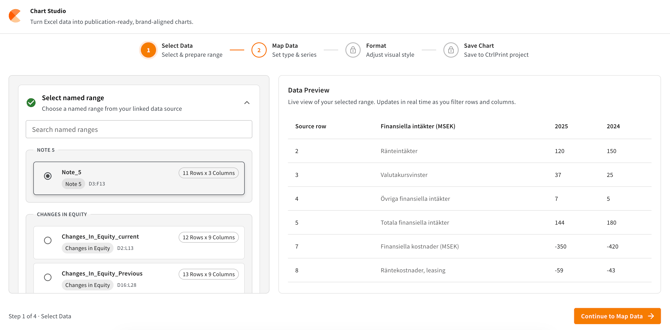
This will open the Chart Studio in a new browser. You can start building your chart here.
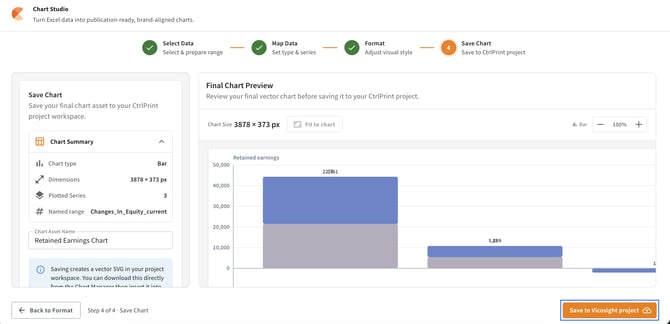
Once you have completed all the necessary steps to select the data, map data and format your chart, you can click "Save to Vicosight project" to save the SVG file back to the server.
You can see the chart in your Chart Panel and see the option to download it as Editable SVG or just SVG file.
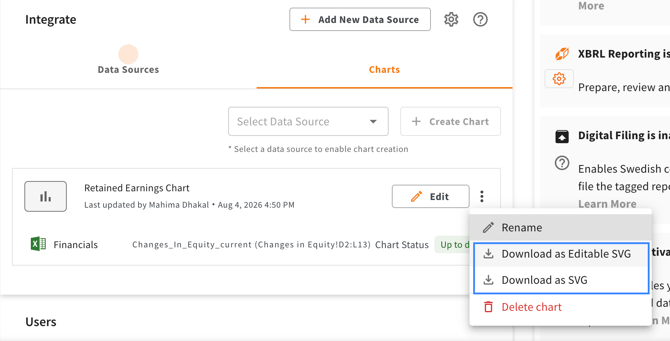
New version of Charts
When you have a new update in the data, you can see that there is an update available for your chart. You can then click on the "Update" button and update your data with the latest data changes and easily save it to the project.
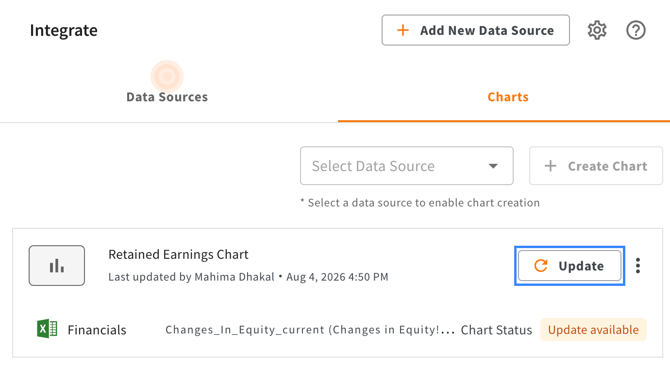
How to link Charts
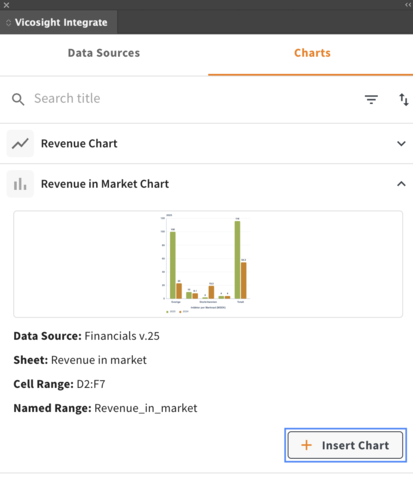
Only InDesign users can insert charts in the document as they are inserted as images when using Integrate Charts panel. You do not need to select a text frame so you can start by clicking Insert Chart button in Integrate Charts panel and insert chart the same way you would insert an image (using "Place") in your document .
This chart stays linked to the data source (as shown in the image below).
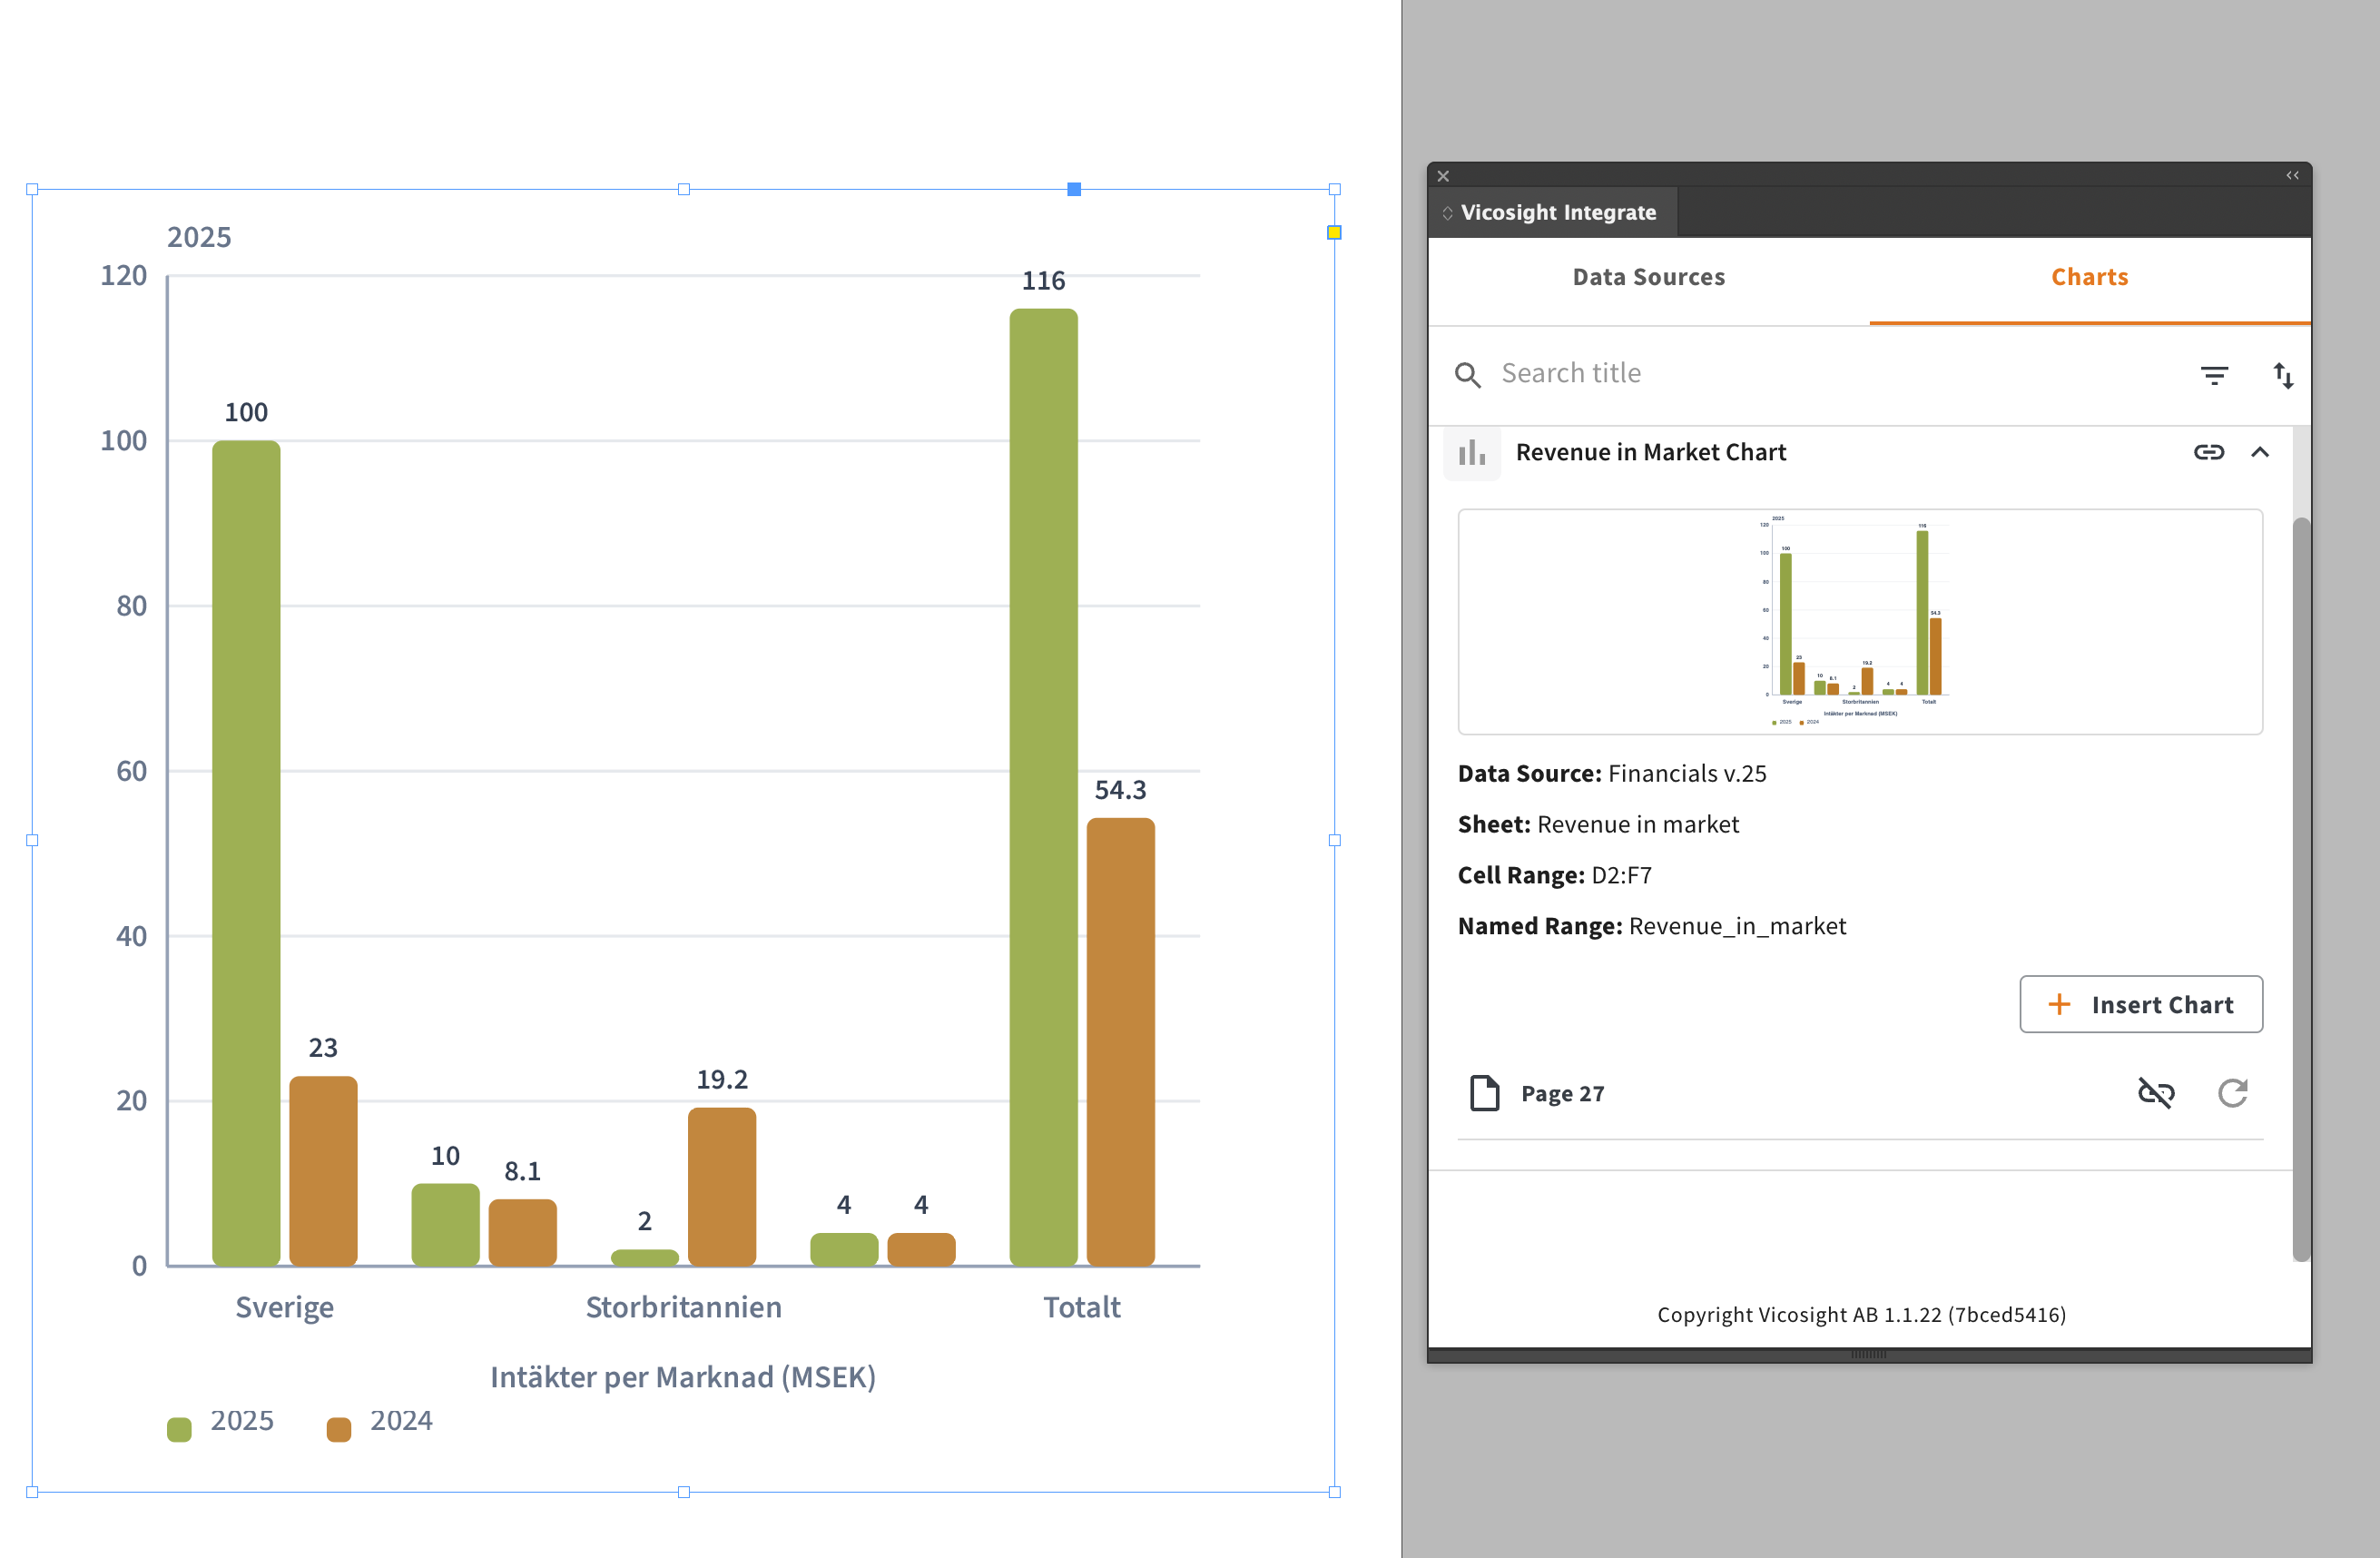
Updating linked chart in the extension
When a new version of a linked chart has been created and saved in the Chart Studio, Integrate will detect the update the next time you open the document.
An orange indicator will appear next to the chart in the Charts tab, showing that an update is available.
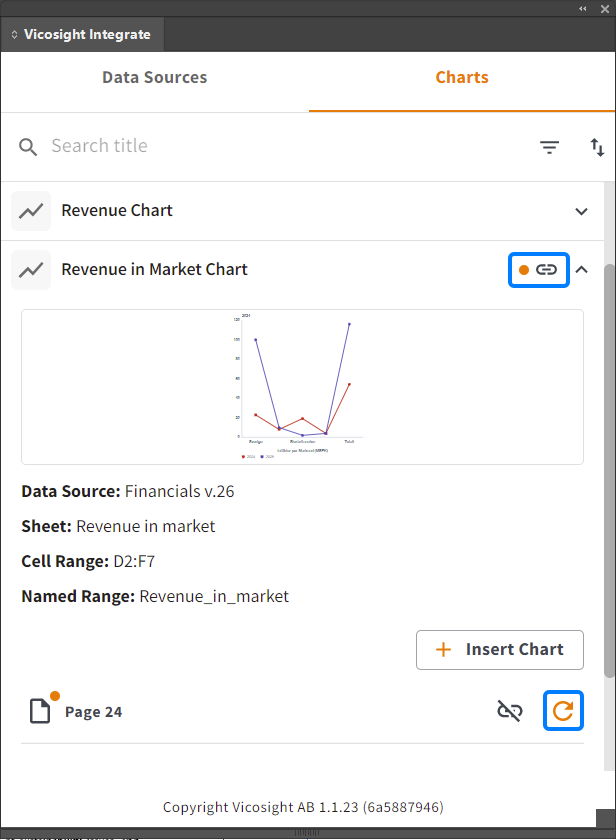
To update the chart, expand it in the Charts tab and click the orange Update icon next to the linked page.
A confirmation window will appear before the chart is updated
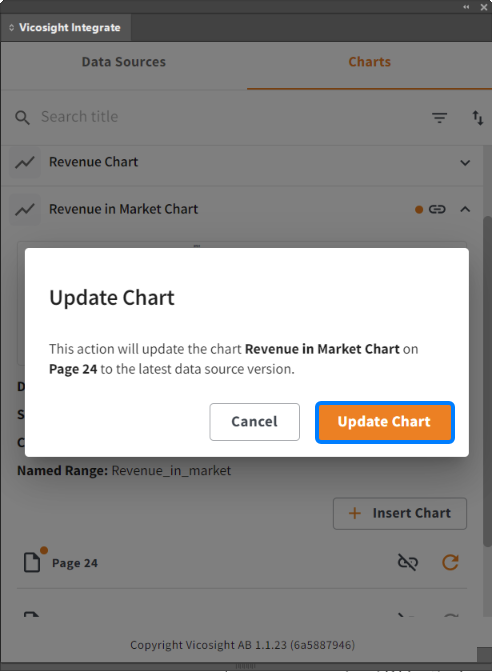
Click Update Chart to confirm. The existing chart in your InDesign document will be replaced with the latest version from Chart Studio.